Dots Connected #6: Optimize your IT architecture to decrease massively your license spend!
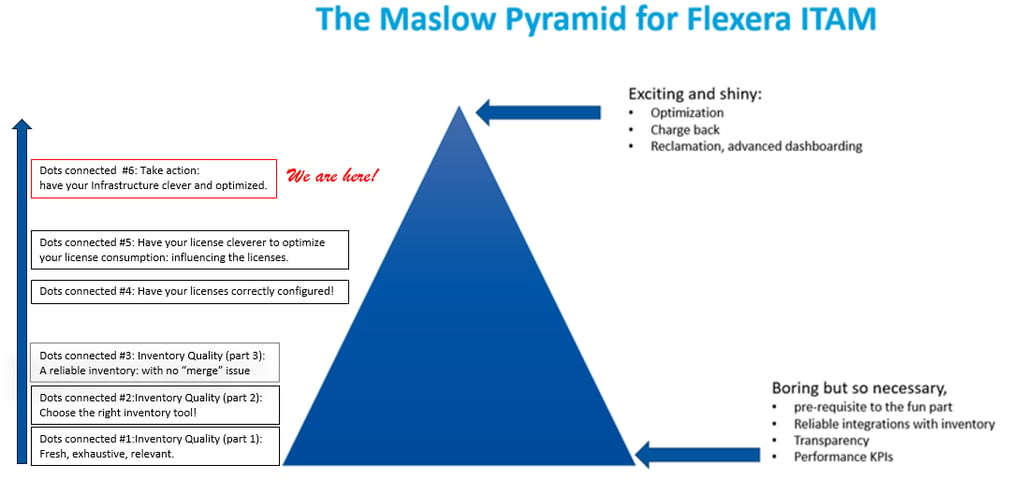
11th of an 18-post series, this “Dots Connected” didactic article gives you best practices on how to use Flexera technology to optimize your architecture and save massively on your license investments. We are getting closer to the top of the Maslow Pyramid of SAM!
4/18/20245 min read

The cool thing with SAM is that costs are so high and rules so complex, that there will be work forever for SAM consultants!
This statement that I have made or heard a lot may appear cynical but reflects the sad truth of Software Asset Management. Are application publishers malicious in their licensing rules?
In the when good intentions, good will and sincerity lead to licensing nightmares and financial waste Flexera blog post, I gave a view on how licensing rules have tried to adapt to technological sophistications and how they have themselves become unmanageable for human beings. This justifies the need for a SAM tool that will constantly collect complex data on IT architectures and compute the license consumption resulting from these architectures and the installed applications. I also showed that from a good intension from people who are paid full time to invent rules that are “fair”, there is a shift to a temptation to introduce complexity leading to “easy and expensive” options or even will introduce hard to detect license cost raises.
SAM managers (helped by tools) have no other option to be as clever as Publishers and better informed on their own estate to avoid a blindness that leads to catastrophic situations of weakness during audits.
So, you are equipped, have deployed the right inventory tools with the right strategy, have configured your licenses to correctly compute license consumption… what is the next step? OPTIMIZE!
There are several types of optimization…
Count license consumption an optimal way, finding the most appropriate editions for your infrastructures, particularly when there is virtualization. This is all the stake with Windows Server, SQL Server and Red Hat Enterprise Linux addressed in the last "dots connected" article.
Modify your architectures to optimize licenses that will be consumed (this post).
Modify your subscriptions and maintenance to align with your true usage (next "dots connected" post).
Today’s post will focus on architecture optimization that applies a lot to Oracle that has the unreasonable soft partitioning rule, but also IBM, Windows Server and SQL Server… All these products have in common that license consumption is computed based on cores (or threads for cloud instances), eventually with factors. These consumption calculations apply more or less nasty rules apply for virtualized environments. In good case a “capping” (on VMs, VM pools, or host) exists which are reducing the consumption potentially to less than (sum of VM cores*factor) basic count. In worst case (Oracle), 1 installed VM requires a full vCenter or VMware group to be licensed.
Flexera one ITAM made a shift when I was a Product Manager from compliance to Optimization as you can see in the SAM Optimization Hub Best Practice Webinar, and you no longer need Excel or expensive consultants to identify possible optimizations through architecture changes. These are some of the reports I created and shared as a consultant and productized as a Product Manager… let’s have a look.
The elephant in the Architecture Optimization room is, with no doubt, Oracle that invented the beautiful "as a car can park anywhere in a parking, it should pay for all places in the parking" rule also known as soft partitioning. This rule requires all cores of a cluster, or vCenter... or VMware group (depending on the version of vCenter) to be licensed if one VM has Oracle database or an option deployed. This is true for Oracle Processor licensing, but also for Named User Plus (NUP) that have "NUP minimums" applied proportionally to Oracle processor consumption.
Oracle Optimization on VMware clusters
The elephant is so big that this Oracle Optimization topic was the first I addressed when I introduced optimization reports in Flexera One ITAM / FlexNet Manager in 2021. Not less than 6 Oracle Optimization reports.
Want to see the ideal architecture?
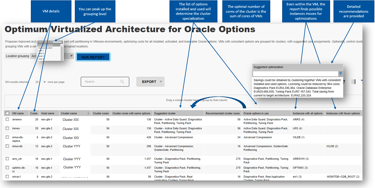
Let's start with the most powerful: Optimum Virtualized Architecture for Oracle Options that recommends you the optimal architecture on VMware Clusters that consists in regrouping VMs with Oracle Database with consistent activated options in specialized clusters. Do you have multiple data centers and cant create a unique worldwide set of clusters? No problem, use the "location grouping" option that will allow to create regional specialized clusters.
Have a look to the Suggested optimization column that contains an evaluation of your saving between your current architecture and the target one suggested by the report... interesting piece of SQL I wrote in the 2022R2 enhanced version of the report. You can find details on this report in the online documentation.

Want to see more details?
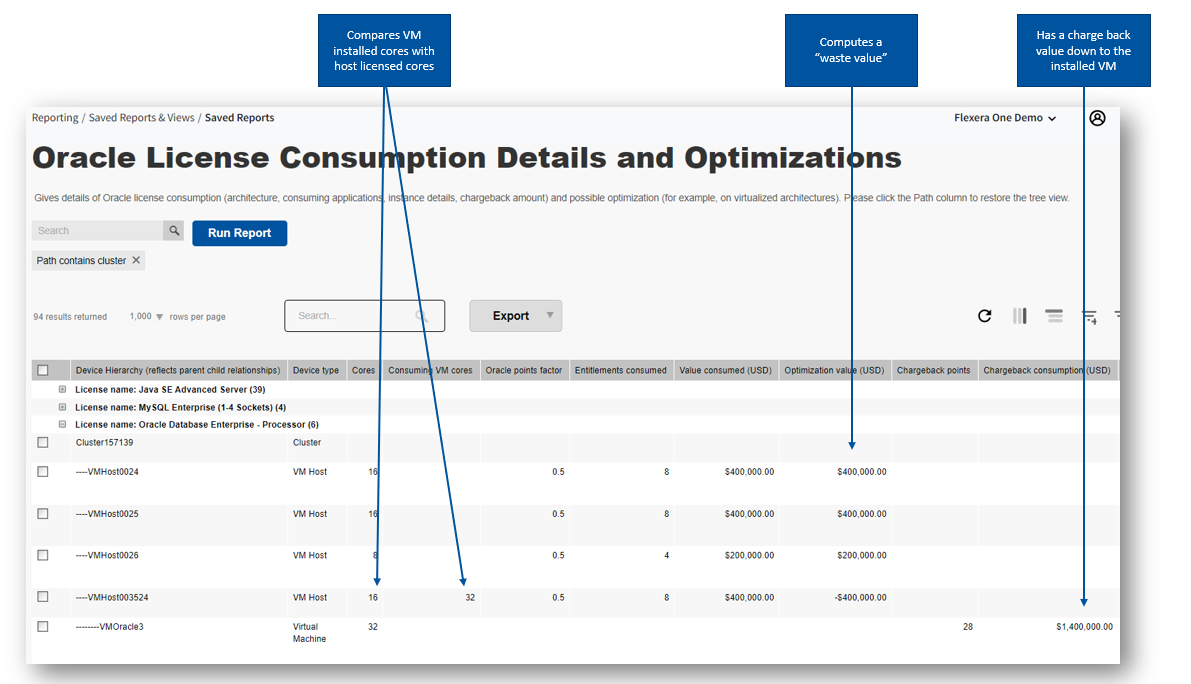
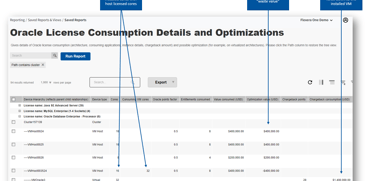
The License Consumption Details and Optimizations report gives all details on architecture, vCenter, Clusters, hosts, VMs, shows consuming Oracle instances, compares installed VM cores and licensed hosts cores, shows a "waste" caused by soft partitioning, computes a charge back costs at installed VM level... full transparency on consumption and possible optimizations.
Want to learn more?
I would recommend some of the recorded SAM Best Practices Webinar I delivered, that you can find in the Flexera Community
You can find the links to the 24 recorded Flexera SAM Best Practices Webinars in the "ITAM Best Practice Available in the Community" Flexera KB article.

Want to understand the financial risk of accepting the vCenter or VMware group level soft partitioning?
This report is not really on architecture optimization but contractual terms and conditions optimization.
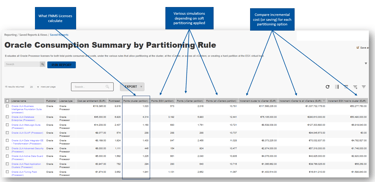
With the Oracle Consumption Summary by Partitioning Rule, you get a side by side financial impact analysis of the various levels of partitioning that are in millions! This calculations include the "affinity level" where all affinity rules are taken into account to compute a theoretical license consumption. All details of the "why" (including all details on affinity rules) can be found in the Oracle Partitioning Rules Impacts report documented here.
What about Oracle Optimization on Hard-Partitioning or Windows Server / Red Hat Linux?
Check the comping "you will love this!" article. NR SAM Consulting have developed a report that catches when pool capping is used or not on LPARs and there will be plans to expend the report to IBM licensing. Moving LPARs to the right pools is also a great way to optimize license consumption.
For Windows Server or Red Hat, stacking VMs is clusters is a great way of taking advantage of the datacenter editions. We just need to find a way to identify the Clusters that are close to the thresholds or compute a potential saving cost projecting the consumption of the highest density cluster to the lower density clusters. More exiting things to develop!
Contacts
info@nrsamconsulting.com